Here it comes: 2025 Final Four. I actually don’t like the concept because single-match eliminations are noisy. In a single-match scenario, there could be a lot of things that may result against the better team such as early foul troubles, bad shot night, unlucky offensive rebounds... From more statistical point of view, one can think of two distributions corresponding to their overall performance. And anytime they play, we sample from those distributions (I simplified things a bit here but one can get to conditional distributions if one wants to). So, this type of scenario is in favor of the underdog.
However, it may make sense from a business perspective. It’s more likely for an upset to happen, which may increase TV ratings (not sure about that). Regardless, I wanted to take a look at the teams…
I’ll take a quick look at the teams through Dean Oliver’s four factors. Here’s each teams’ performance in regular season:
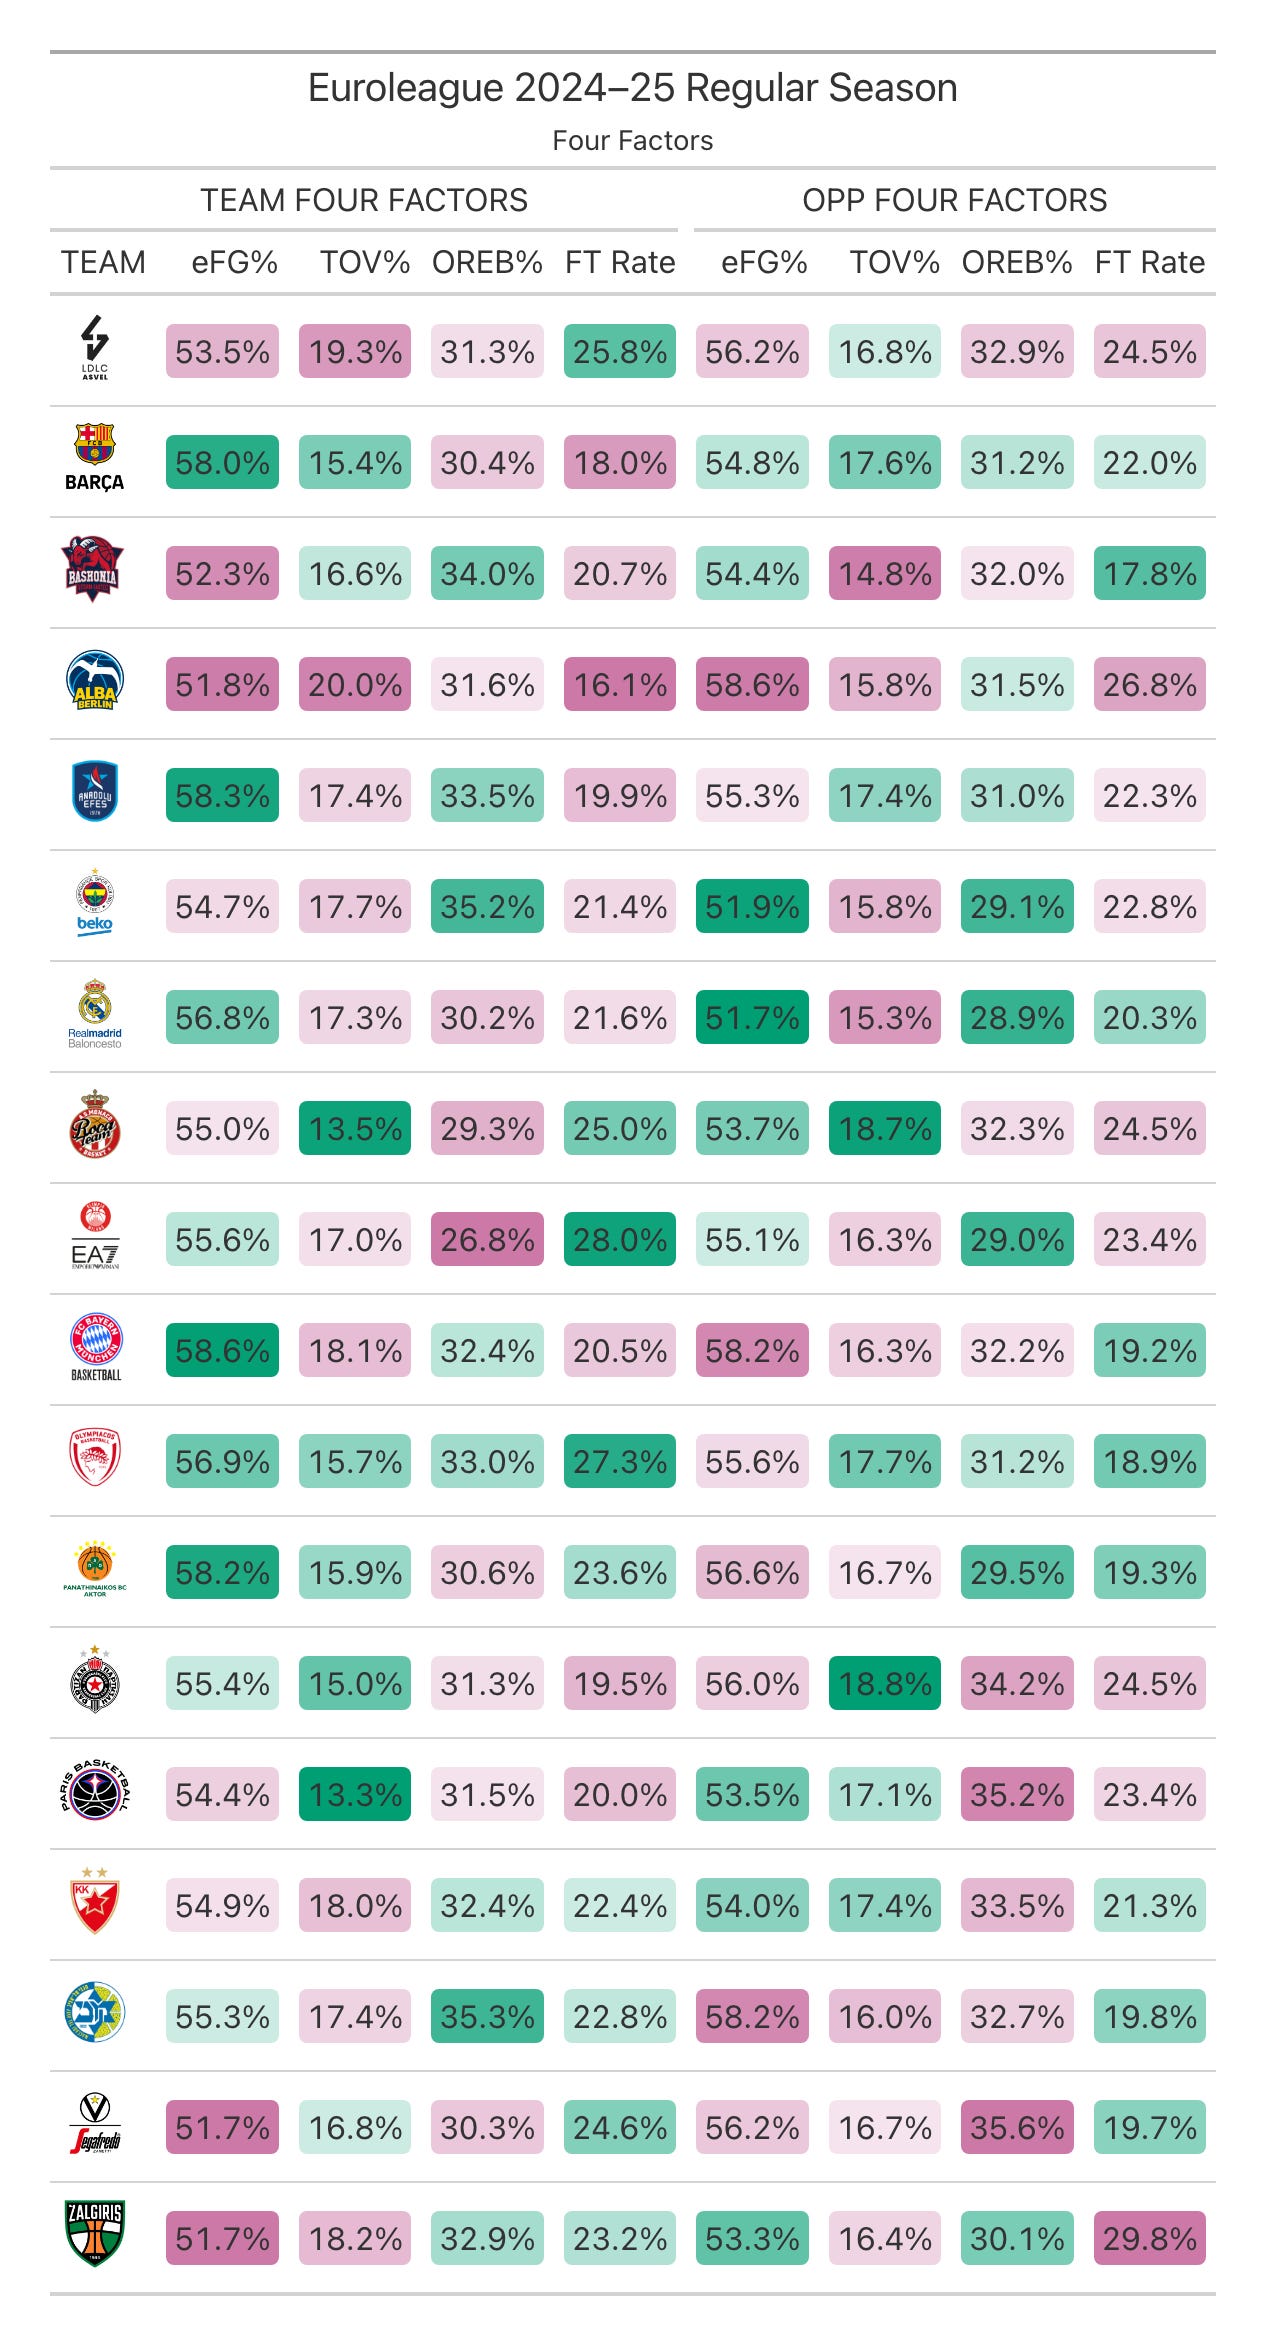
Since the table includes a lot of information for us to process, I color coded it with respect to hue and saturation. If you’d like to look for good values you should chase the green colors above.
Before focusing on final four teams in the table above, I’d like to add that these calculation excluded low importance possessions since teams’ portion of low importance possessions are not equal. Meaning that possessions that don’t swing the win probability much are filtered out. I have some criticism to this approach but it’s not within the scope of this post. Anyway, let’s go:
On the offensive end, PAO stands out. Other than offensive rebound percentage (OREB%), they seem to be doing really well. Effective field goal percentage (eFG%), which adds extra value of 3s into the calculation to quantify efficiency from the field, is given the most value by Dean Oliver. They take the 3rd place under this metric, behind Bayern and Efes.
Fener seems to be grabbing huge portion of available offensive rebounds, which may produce problems for PAO (I wonder if Lessort would make a lot of difference). Also, they rank the second in opponent eFG%.
Monaco is the team with second lowest turnover percentage (TOV%), behind Paris. They also force 18.7 turnovers per 100 possessions. So, it seems like one should watch out for turnovers against Monaco.
OLY seems to be doing good in pretty much everywhere as indicated by greens all over their row other than opponent eFG% and they are not so bad in that as well.
Well, the table above is in aggregate. We don’t know which matches drive those stats upwards. Hence, here’s a different version for offensive four factors:
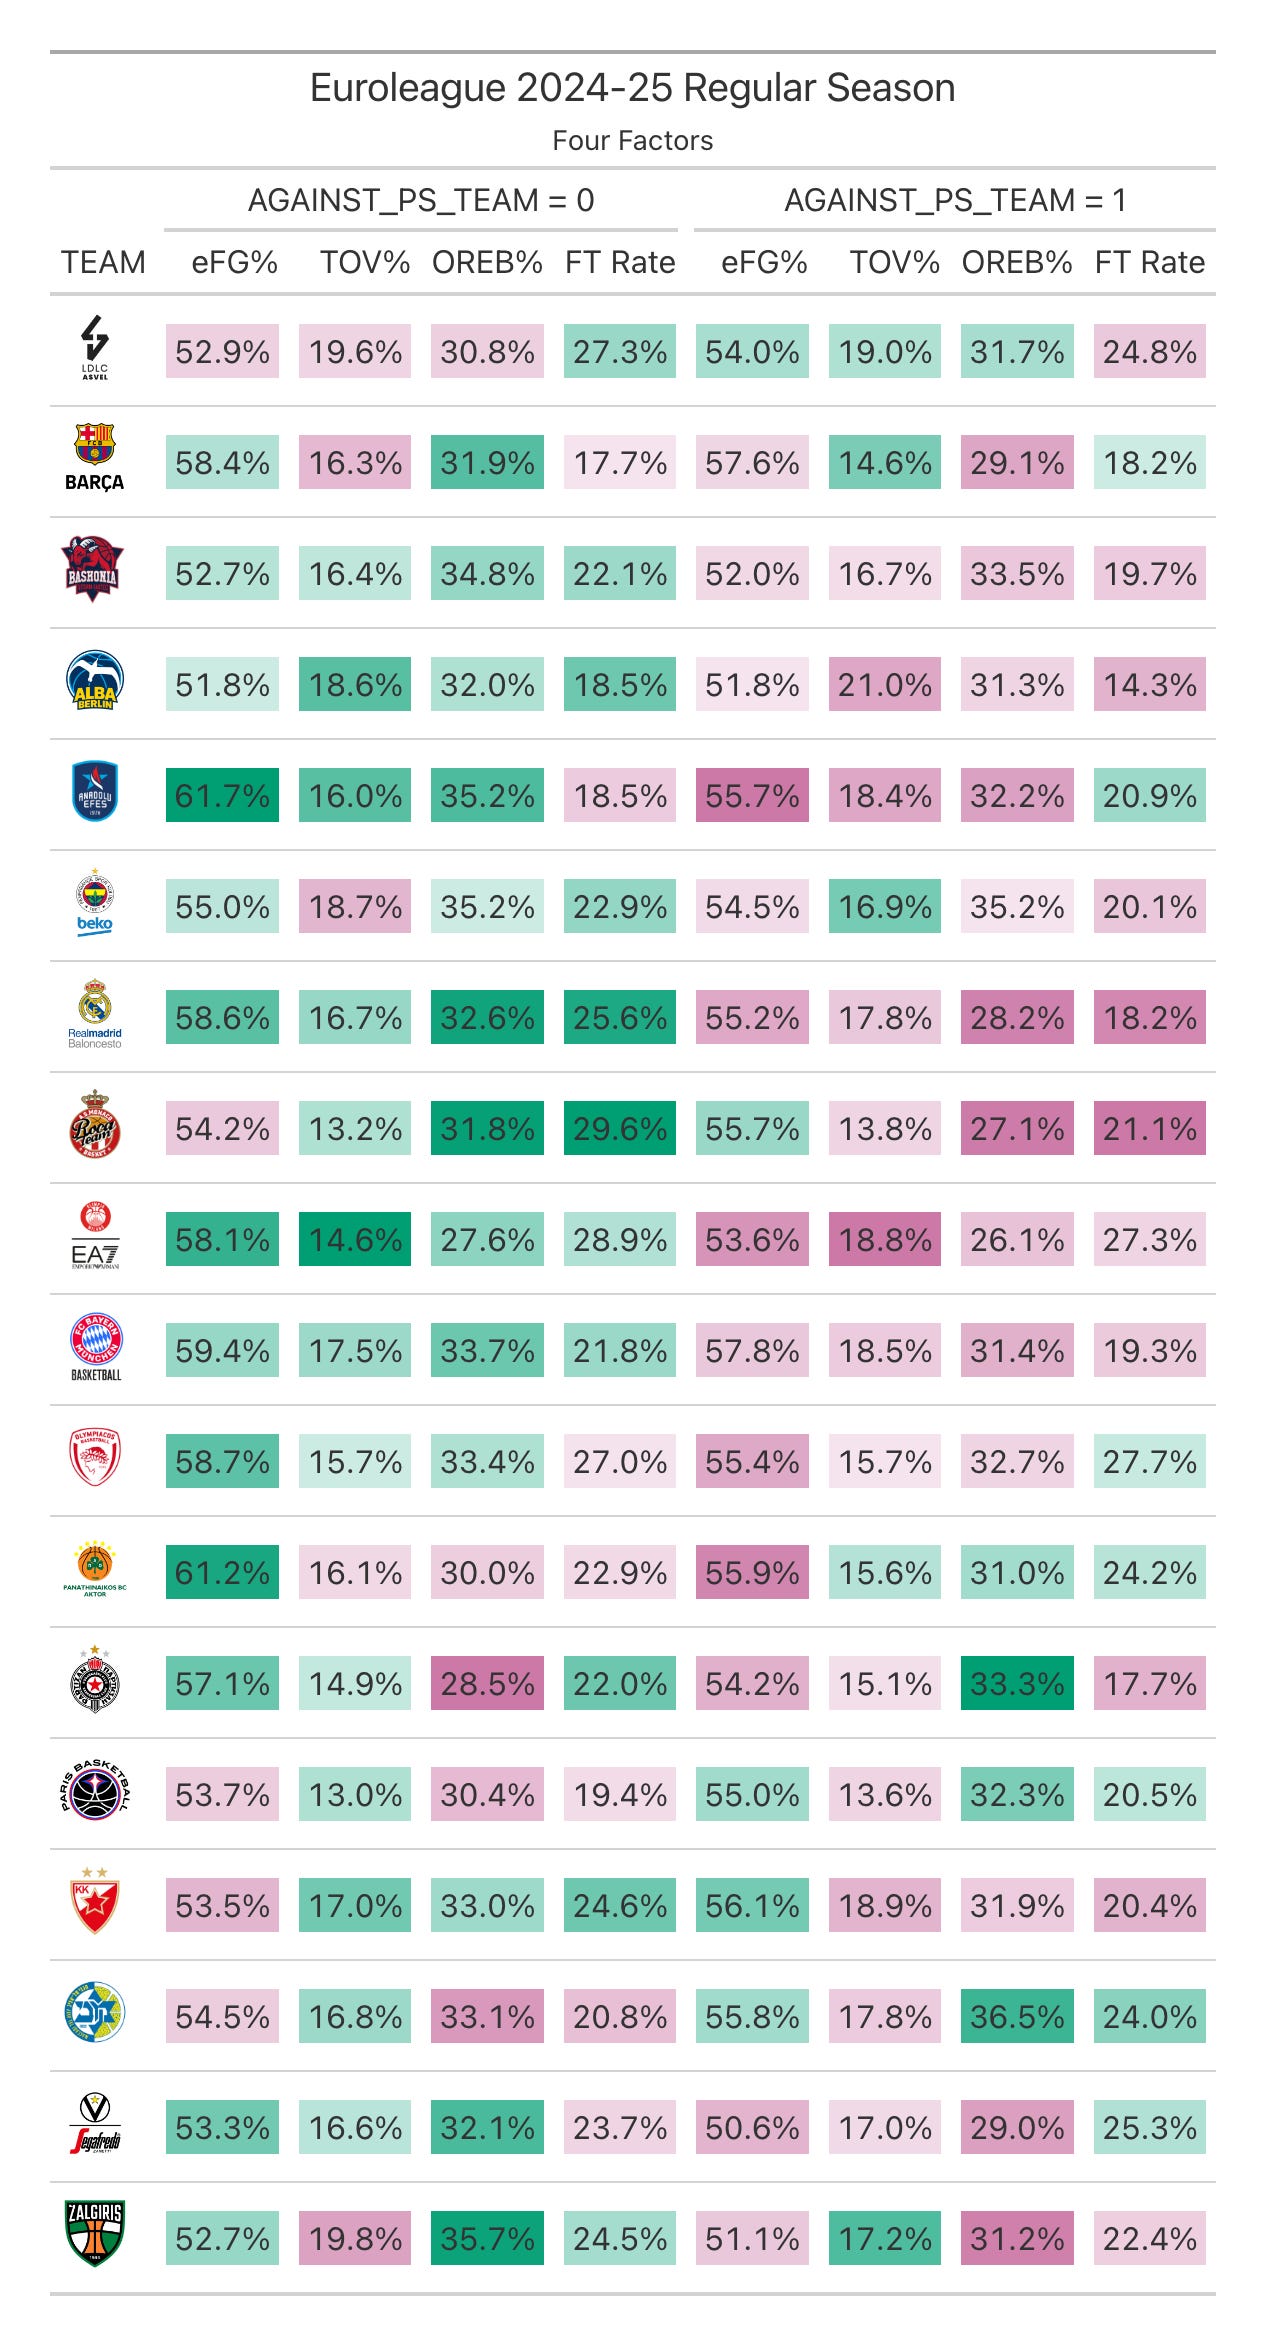
Now the color coding is row-wise. If a teams full green on the left side, it means they are performing better offensively against non-playoff teams. For example, Efes’ eFG% 6% lower against post-season teams (PS teams).
While PAO is definitely shooting worse against post-season teams (difference of 5.3%), there seems to be increase in other aspects.
Fener’s TOV% is lower against post-season teams. This might be result of taking good care of the ball and being more cautious against such teams. There’s not a lot of differences in other metrics.
Monaco drives much of their stats from non-playoff teams. There’s a huge 8.5% decrease in FT rate against playoff teams.
OLY sees biggest drop in eFG%, by 3.3%. Other than that, differences do not seem to be drastic.
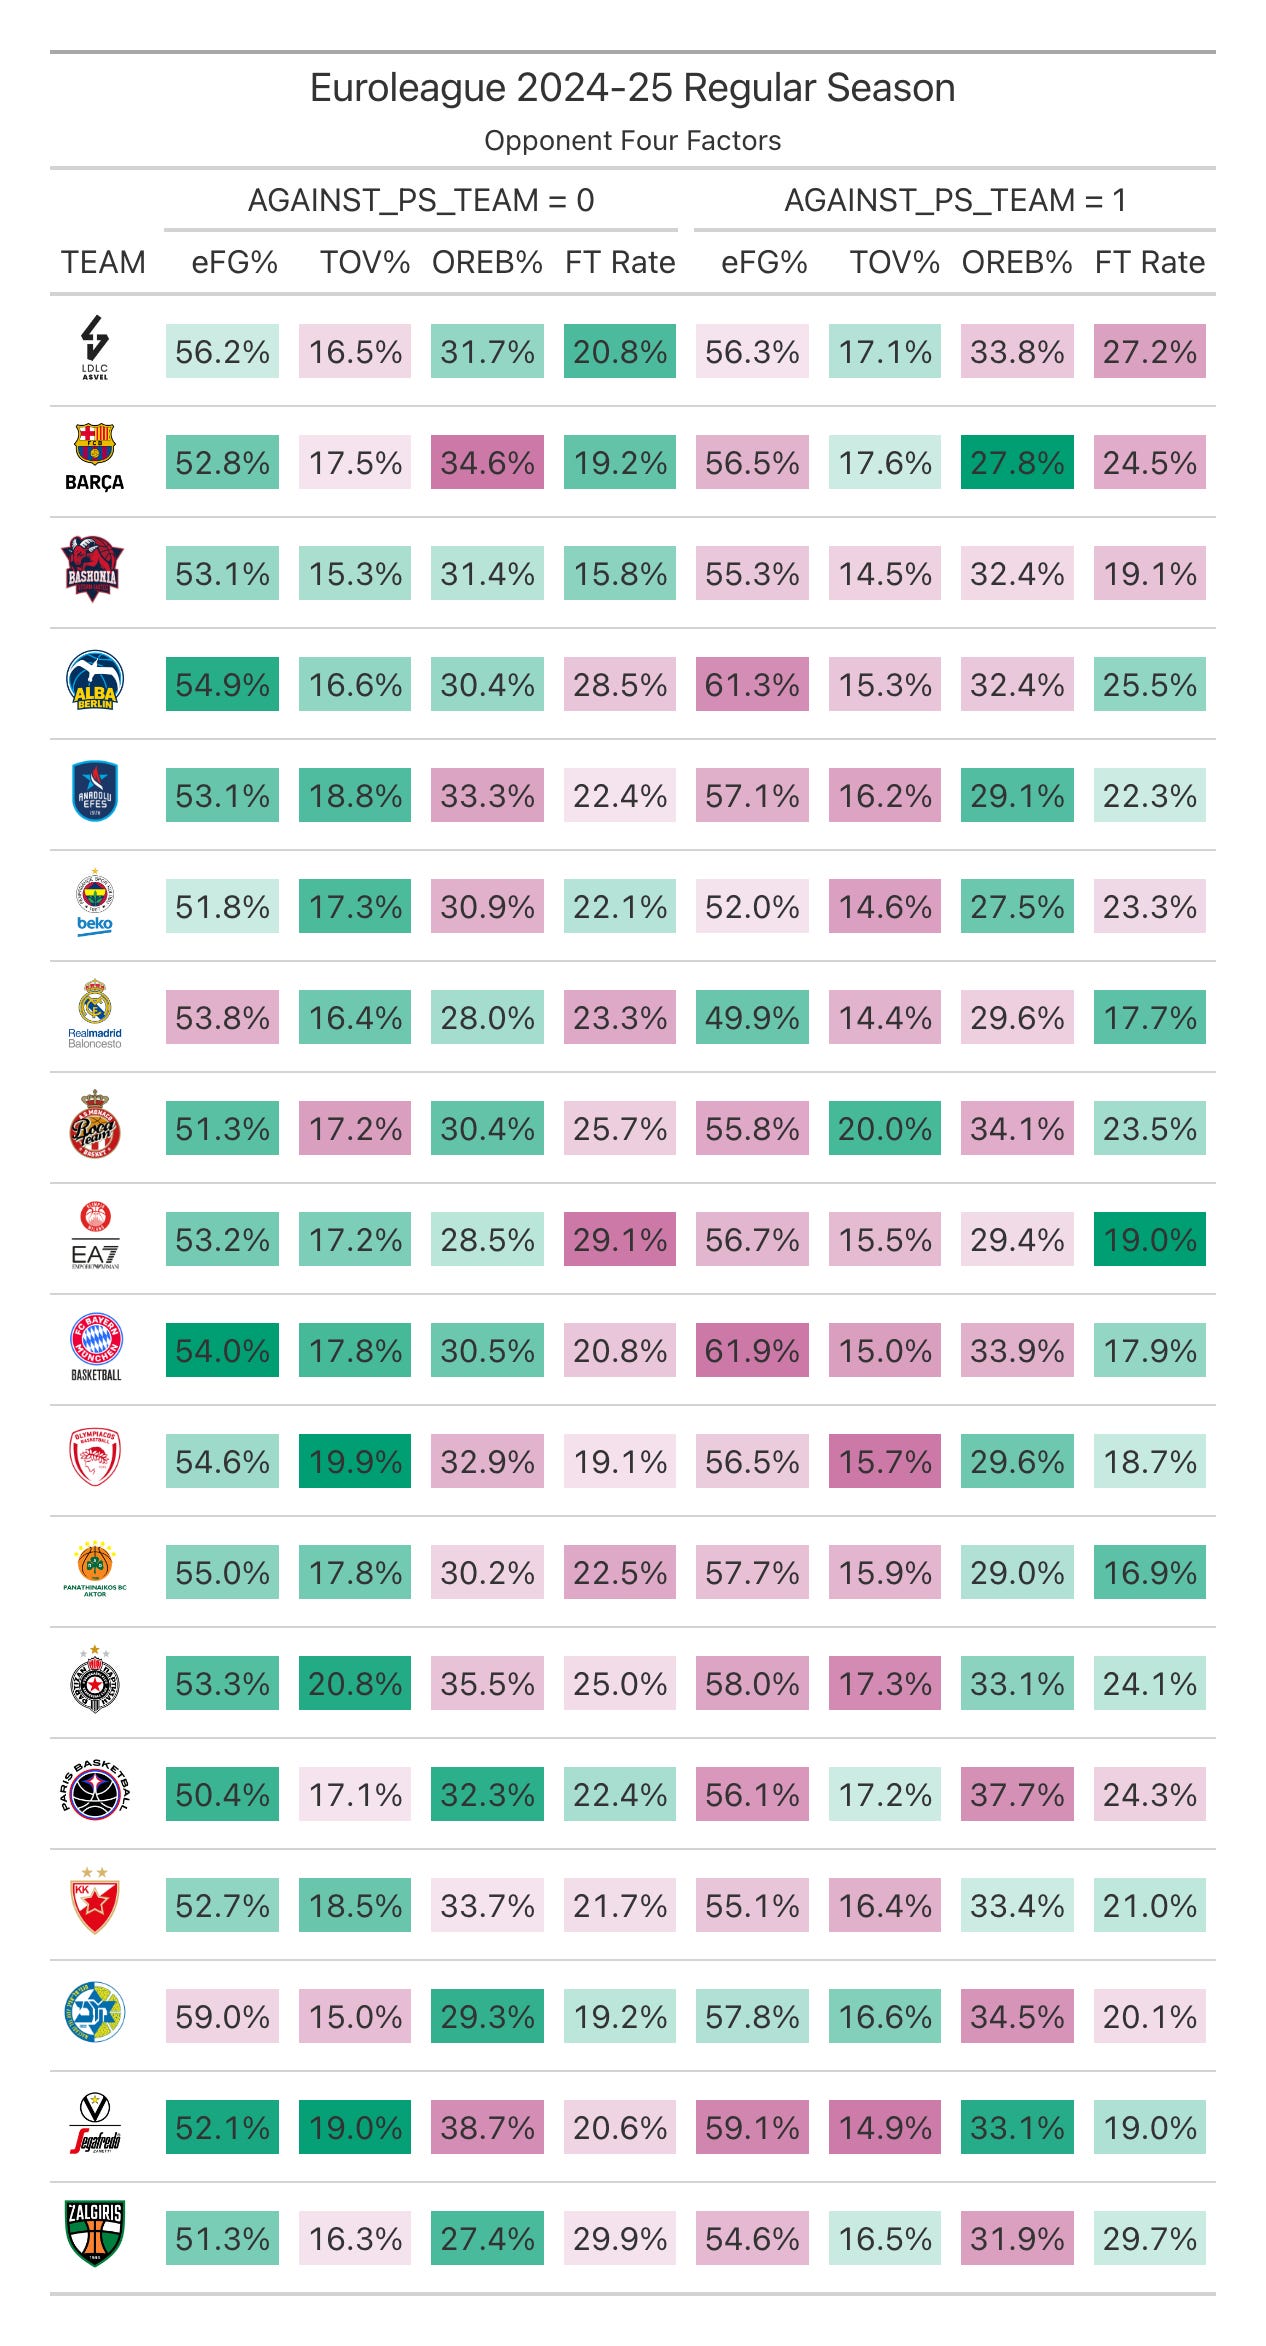
I think you generally got the idea so I’m dropping the defensive four factors below for you to investigate. I don’t think I’ll write another piece before the final four so, see you after the results!