When Nikola Jokić was once asked about getting booed by opposing fans, he calmly replied, “I played in Serbia, brother.” Cold line…
Jokić was pointing to a real difference between NBA and European basketball environments. While NBA fans often lean toward the more casual or entertainment-driven side, European fans (I’m mainly referring to EuroLeague fans) are known for being intensely passionate. So when a player like Jokić, who came up through that environment, gets booed in an NBA arena, it barely bothers.
I once read that home-court advantage (HCA) in the NBA is worth around 5% in win probability. That made me wonder: what about the EuroLeague? How much is it actually worth, in terms of points, to play at home?
Well, we can’t just take a look at how often the home team (HTM) wins since team strength (STR) is also a factor (among some other stuff). I specified a model by taking the dependent variable as points margin (PTS_MARGIN) at the end of the game, in respect to HTM. In other words, positive values mean the home team won, and negative values mean they lost. Hence:
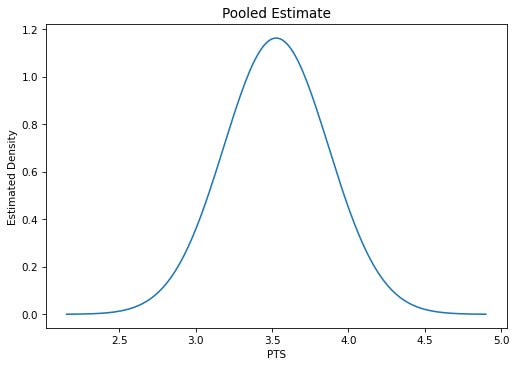
I used five regular seasons (2020 to 2025) of data to fit the model, which gave me the following:
The distribution above is centered around 3.5 points, where 94% highest density interval (HDI) ranging from 2.8 to 4.2. It means our best guess for home-court advantage is +3.5ish points, across all teams and seasons. This seems to be somewhat in line with our intuition.
However, this is a pooled estimate, which means:
I specified team strengths to be fixed across seasons where each team is assumed to have one underlying strength, regardless of roster changes or performance shifts from year to year.
I specified home-court advantage to be constant across seasons as well, meaning it reflects an overall average effect rather than any season-specific variation.
But of course, teams change year to year. There are roster changes, coaches come and go, all have some effect on the team performance. So, I opted for a more flexible model specification which partially pools information across seasons. This means both home-court advantage and team strength are now allowed to vary from season to season, rather than being fixed. With that being said, they are not completely independent. In other words, model does not assume each season as completely separate world like it would be with an unpooled estimate (i.e., separate model for each season).
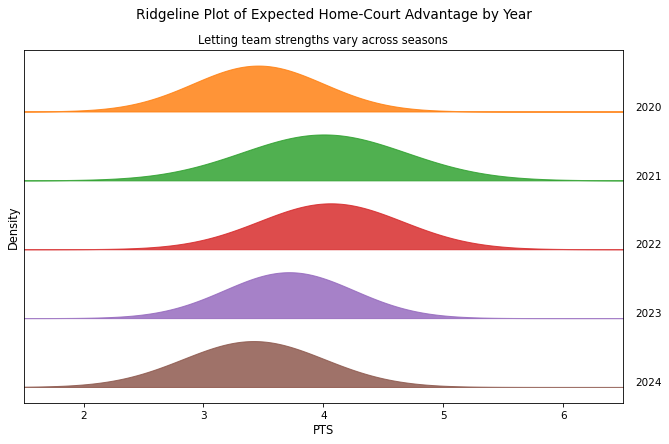
This way, we end up with a global distribution alongside distributions for each season. Here they are:
Well, center of the estimates (i.e., best guess for that season’s HCA) are still in the ballpark of ~3.5 expected points, for each season, while 2021 and 2022 centered at little higher alongside increased spread which means we are less for those seasons.
Do you remember Luka mentioning how hard it was to go up against Panathinaikos in OAKA? Or, I remember watching Fener vs Alba this year, seeing Alba’s stadium at Berlin full of Fenerbahçe fans.
Some teams have louder fans, or arenas that are just harder to play in. This may result in different HCA across teams. To capture that, I expanded the model and let home-court advantage vary not just by season—but by team and season.
This type of model specification gives us three estimates:
One global distribution, standing for overall average HCA across seasons and teams.
One per-season distribution, showing how HCA shifts year to year at the league level.
One team-by-season estimate, which tells us how each team’s home-court advantage changes each season (also provides team-specific HCA).
I’m going to give some plots for the teams but it's worth noting that the team-specific home-court advantage estimates come with a fair amount of uncertainty, reflecting the deep hierarchical structure of the model (global mean → seasonal shift → team-level deviation) alongside not having many data as some of the other leagues (such as NBA).
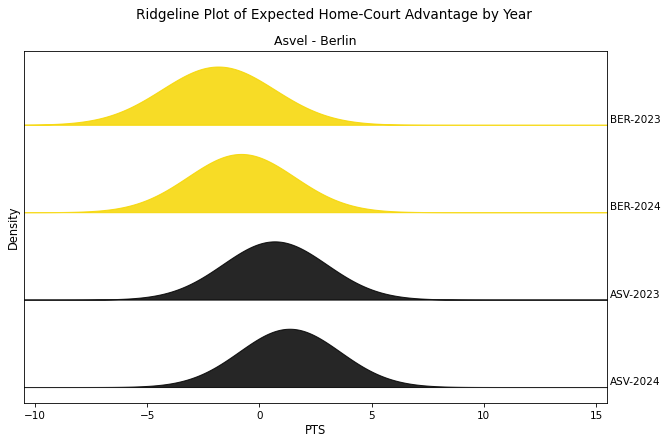
Panathinaikos (Pana) has one of the most passionate fanbases in Europe. I remember attending the Efes–Panathinaikos game this past season and occasionally hearing the Pana fans over the home crowd—even in Istanbul. That kind of presence isn’t negligible, and seems to be reflected in the data. According to the model, Panathinaikos appears to benefit more from home-court advantage than most teams.
In contrast, ALBA Berlin doesn't seem to benefit the same from the crowd. In games against Turkish teams, for example, the atmosphere often feels more neutral than home-leaning, which might help explain their lower estimates.
All in all, this model gives us more realistic view of home-court advantage in the EuroLeague. It's no longer a single league-wide number, but something that can shift over time, across teams, and with varying degrees of certainty.
Further ideas:
There are few things I have in mind for the future approaches:
Using possessions within each match as the unit of observation, rather than final point margin, including possession related variables. This could help reduce noise and allow us to model outcomes in terms of points per possession, which is often a more informative and technically sound metric. Alongside change in the unit of observation, filtering garbage time could help increasing signal since back and forth during the game time where the winner has been already decided is not very helpful for the model.
Rest days may also play a role (also travel distance). If the home team had more time to rest than the visiting team, what looks like home-court advantage might actually reflect a scheduling imbalance.
I’d also like to explore arena-related factors like crowd noise or attendance percentage. These could be potential moderators of the home-court effect, including them might help explain why some places just feel tougher to play in than others.
Some of these ideas require external data, but they’re within reach (to some extent) and I plan to follow up with models that include them.
Until then, here’s an additional plot that includes teams that played in the EuroLeague since 2020.


